Analysis#
In this tutorial, we introduce the basic analysis of proxies with cfr.
[1]:
%load_ext autoreload
%autoreload 2

import cfr
print(cfr.__version__)
import pandas as pd
import numpy as np
Load the PAGES2k network and access a ProxyRecord#
[2]:
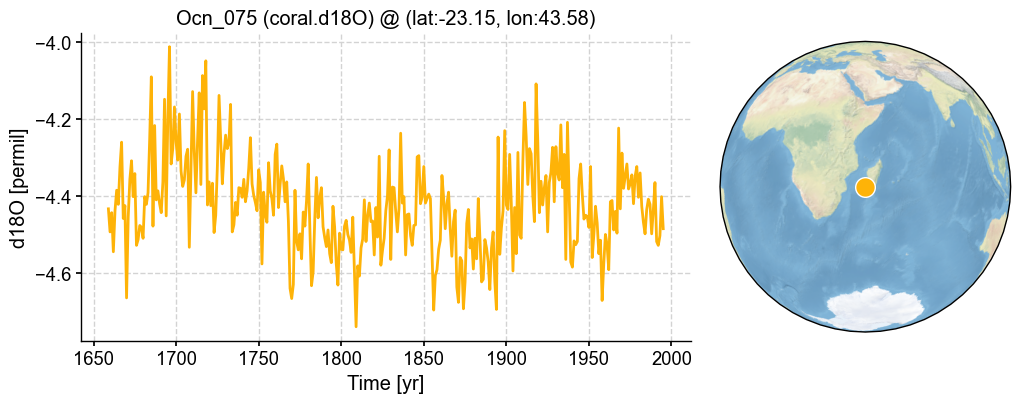
pdb = cfr.ProxyDatabase().fetch('PAGES2kv2')
pobj = pdb['Ocn_075']
fig, ax = pobj.plot()
Annualize a ProxyRecord#
[3]:
# annaulize by calendar year
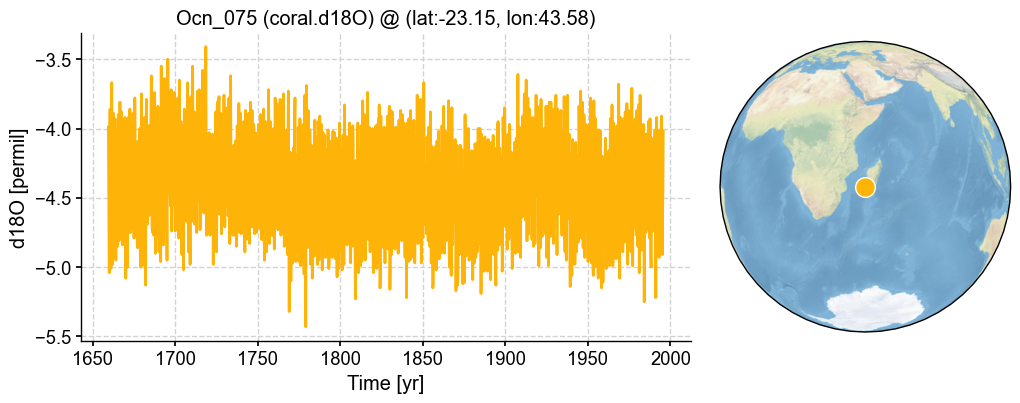
pobj_ann = pobj.annualize()
fig, ax = pobj_ann.plot()

[4]:
# annaulize by a season
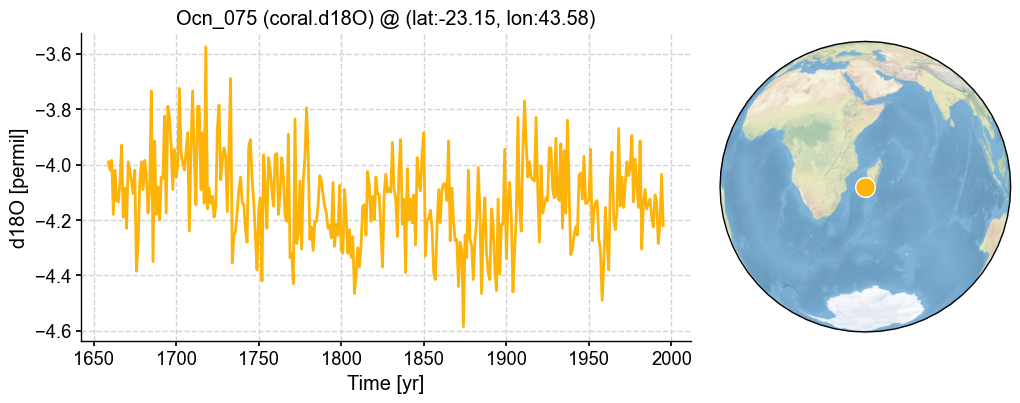
pobj_jja = pobj.annualize(months=[6, 7, 8])
fig, ax = pobj_jja.plot()
[5]:
# annaulize by a season
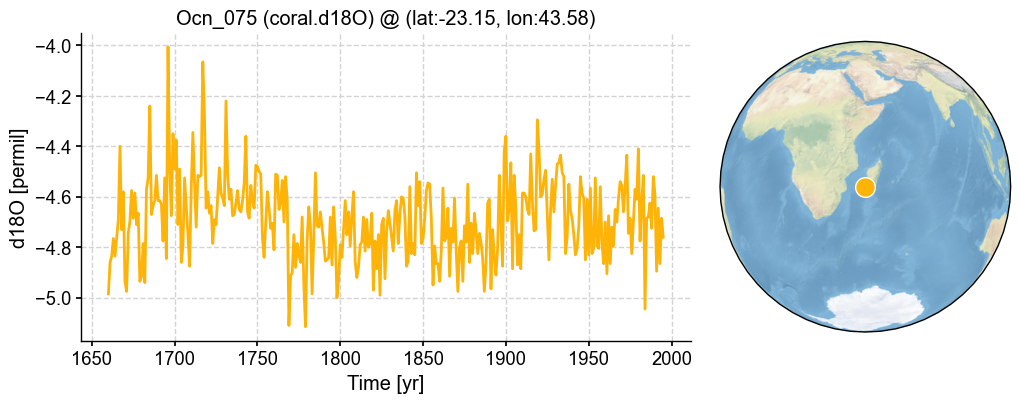
pobj_djf = pobj.annualize(months=[12, 1, 2])
fig, ax = pobj_djf.plot()
Annualize a ProxyDatabase#
Note that the .annualize() method supports only years starting from 1 CE, and we will need to slice the database first if the time axis of some records go back beyond 1 CE.
[6]:
pdb_ann = pdb.filter(by='ptype', keys='coral.d18O').annualize()
fig, ax = pdb_ann['Ocn_075'].plot()
Annualizing ProxyDatabase: 100%|██████████| 67/67 [00:01<00:00, 37.43it/s]