Database Filtering#
In this section, we illustrate how to filter the pseudoPAGES2k dataset in various ways with cfr.
Required data to complete this tutorial:
pseudoPAGES2k: ppwn_SNRinf_rta.nc
[1]:
%load_ext autoreload
%autoreload 2

import cfr
print(cfr.__version__)
2023.7.21
Load the pseudoPAEGS2k dataset#
[2]:
# load the pseudoPAGES2k database from a netCDF file

# load from a local copy
# pdb = cfr.ProxyDatabase().load_nc('./data/ppwn_SNRinf_rta.nc')

# load from the cloud
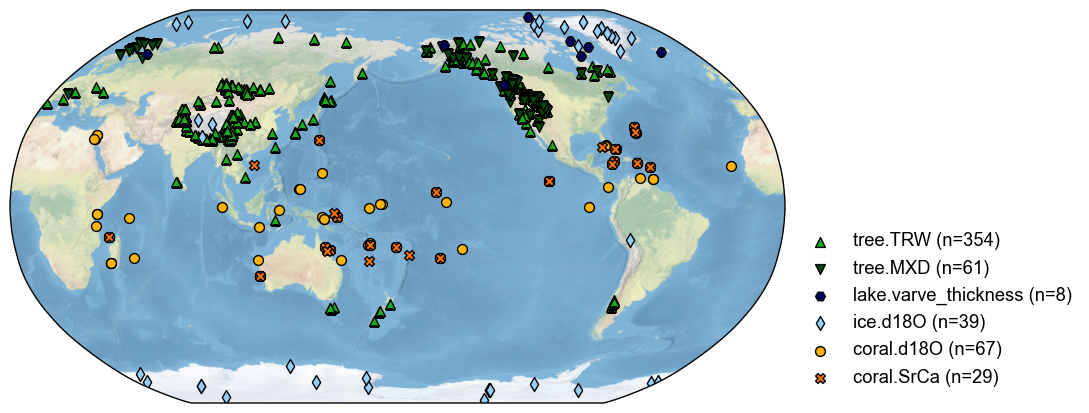
pdb = cfr.ProxyDatabase().fetch('pseudoPAGES2k/ppwn_SNRinf_rta')

# plot to have a check
fig, ax = pdb.plot()
Filter the pseudoPAGES2k dataset#
The cfr.ProxyDatabase class comes with a .filter() method that can help us filter the database in various ways.
By proxy types#
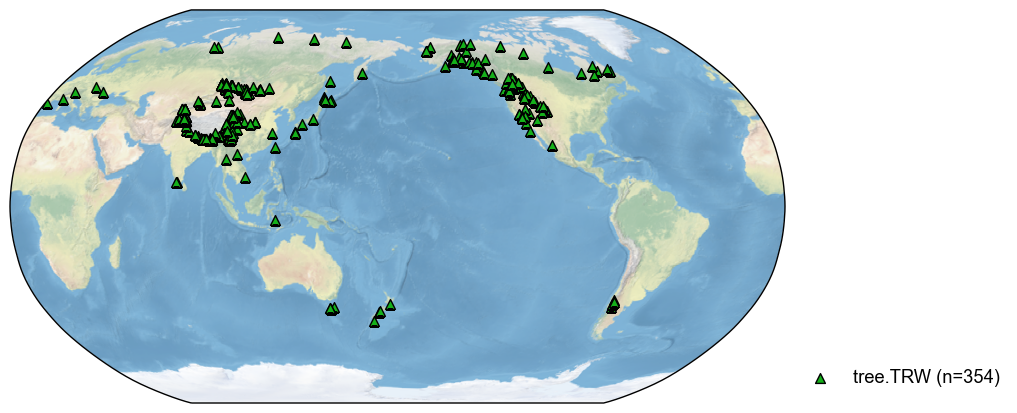
The most common way to filter a proxy database is by the proxy types. For instance, to get a subset of the database for TRW records:
[3]:
pdb_trw = pdb.filter(by='ptype', keys='tree.TRW')
fig, ax =  pdb_trw.plot()
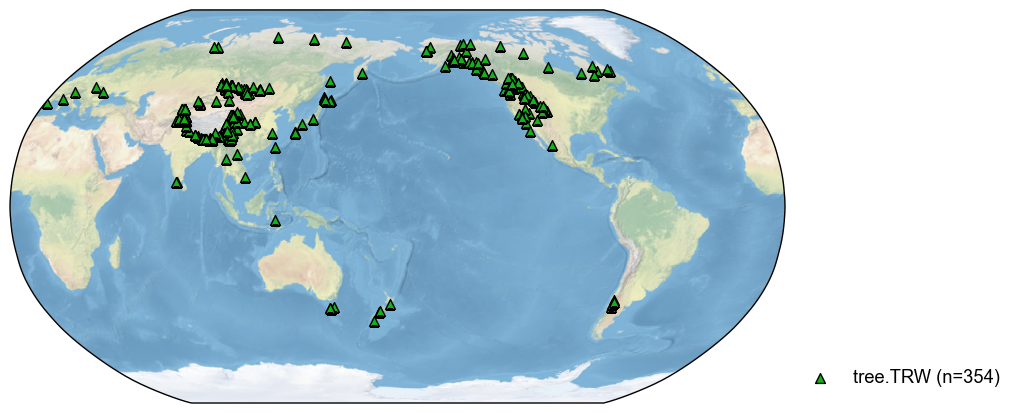
The method supports fuzzy search, so the below works as well:
[4]:
pdb_trw = pdb.filter(by='ptype', keys='RW')
fig, ax =  pdb_trw.plot()
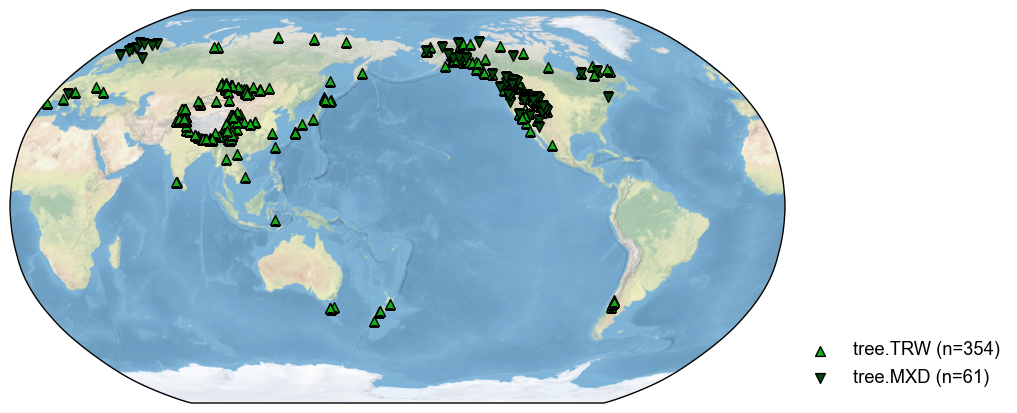
With this feature, we may search multiple types:
[5]:
pdb_tree = pdb.filter(by='ptype', keys='tree')
fig, ax =  pdb_tree.plot()
[6]:
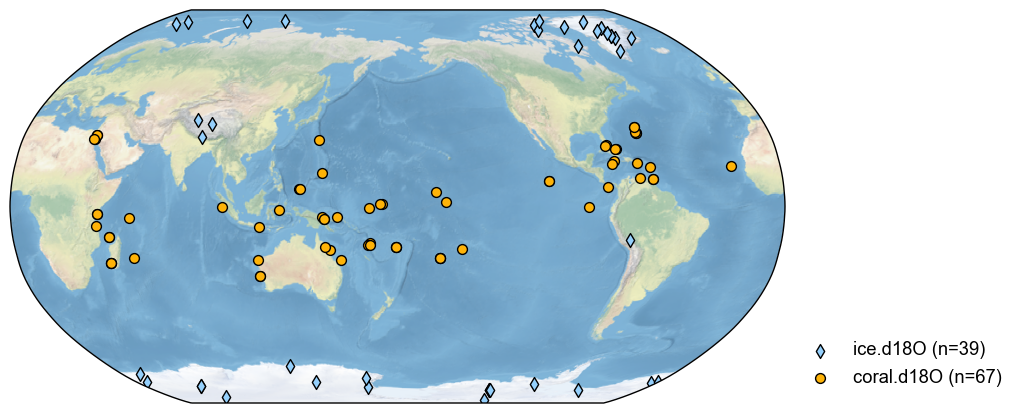
pdb_d18O = pdb.filter(by='ptype', keys='d18O')
fig, ax =  pdb_d18O.plot()
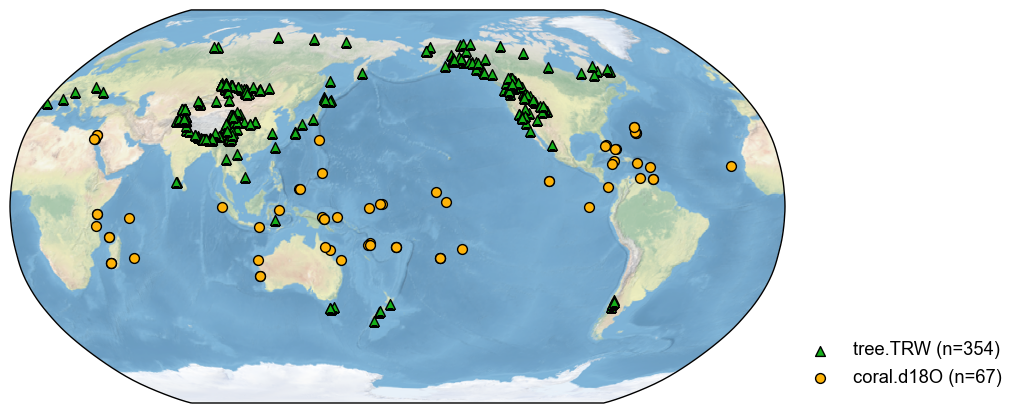
To search arbitrary multiple types, simply use a list of the keys:
[7]:
pdb_mix = pdb.filter(by='ptype', keys=['tree.TRW', 'coral.d18O'])
fig, ax =  pdb_mix.plot()
By proxy IDs#
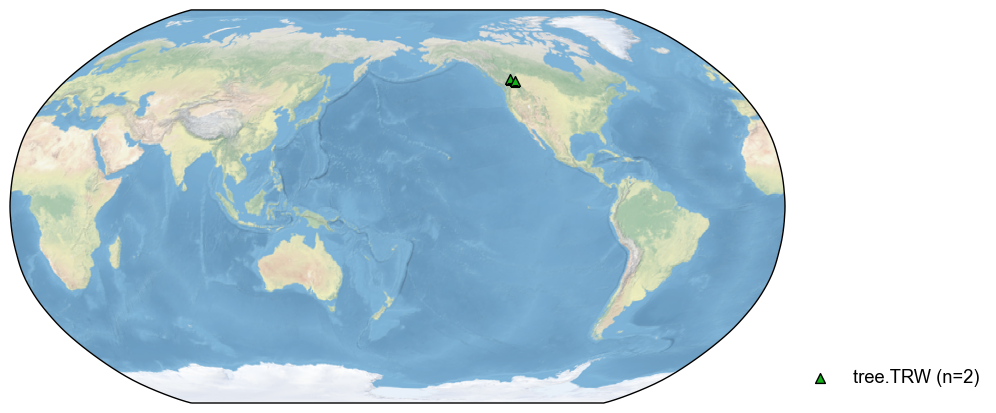
In some cases, we would like to get a subset of the database consisting of certain records that we know the IDs ahead. For instance, we may list several proxy IDs (pid):
[8]:
pdb_sub = pdb.filter(by='pid', keys=['NAm_153', 'NAm_154'])
fig, ax = pdb_sub.plot()
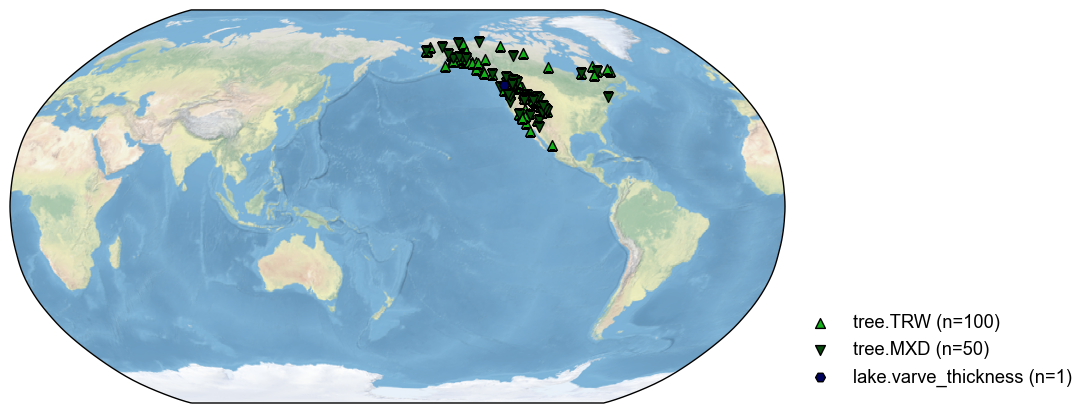
With the fuzzy search feature, we may get a subset of all the North America sites:
[9]:
pdb_NAm = pdb.filter(by='pid', keys='NAm')
fig, ax = pdb_NAm.plot()
By a latitude range#
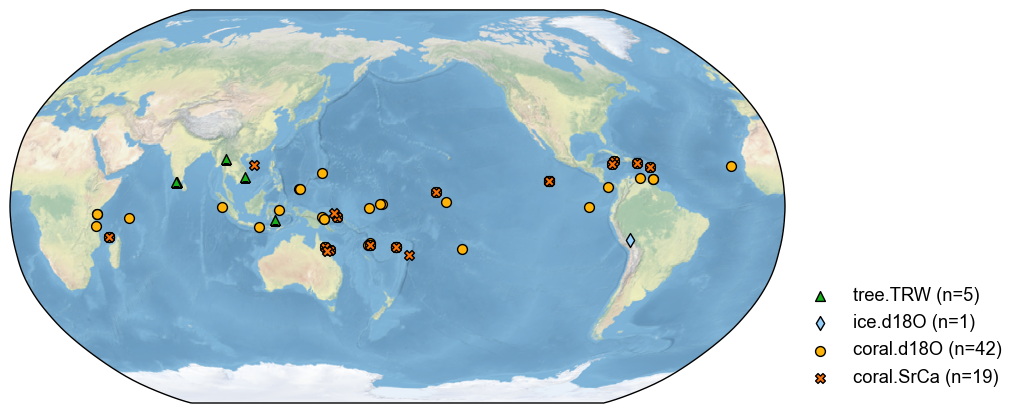
Sometimes, we only need to use the records within a latitude range. For instance, the tropical records:
[10]:
pdb_lat = pdb.filter(by='lat', keys=[-20, 20])
fig, ax = pdb_lat.plot()
By a longitude range#
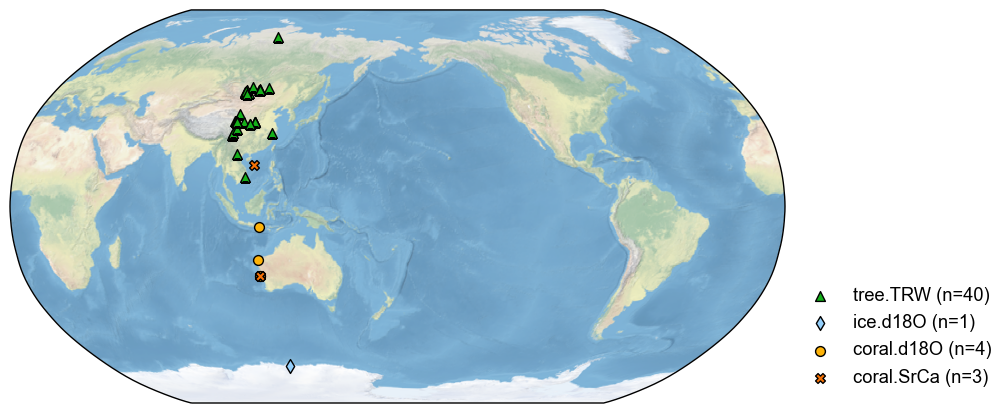
Similarly, we may filter the database by a longitude range. For instance:
[11]:
pdb_lon = pdb.filter(by='lon', keys=[100, 120])
fig, ax = pdb_lon.plot()
By a square (latitude + longitude ranges)#
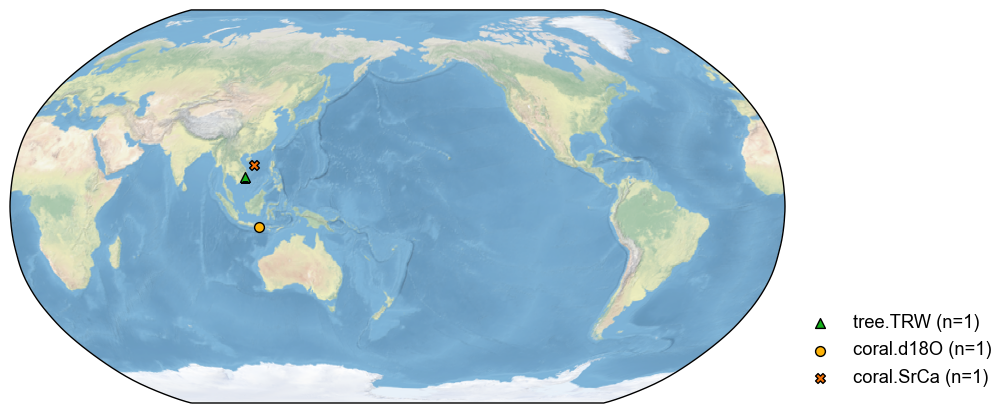
We may also filter the database by a square specified by the min & max of the lat & lon. In this case, the argument keys represents a list [lat_min, lat_max, lon_min, lon_max]. For instance:
[12]:
pdb_square = pdb.filter(by='loc-square', keys=[-20, 20, 100, 120])
fig, ax = pdb_square.plot()
By a circle (center + distance)#
Sometimes, we would like to search for the records around a center location. In this case, the argument keys represents a list [lat, lon, distance]. For instance:
[13]:
pdb_circle = pdb.filter(by='loc-circle', keys=[15, 100, 3000])
fig, ax = pdb_circle.plot()
