Validation Dashboards#
In this section, we illustrate how to plot dashboards comparing the real and pseudo PAGES2k datasets for specific records with cfr.
Required data to complete this tutorial:
PAGES2k: pages2k_updated_Palmyra_dataset.pkl
pseudoPAGES2k: ppwn_SNRinf_rta.nc
Note that the paleoclimate time series analysis package Pyleoclim is also required to perform the spectral analysis in the dashboards (pip install pyleoclim).
[1]:
%load_ext autoreload
%autoreload 2

import cfr
print(cfr.__version__)
import pandas as pd
import numpy as np

# change plotting style
cfr.visual.set_style('web', font_scale=1.2)
2023.7.21
Load the real and pseudo PAEGS2k datasets#
[2]:
# load the real PAGES2k dataset

# load from a local copy
# df = pd.read_pickle('./data/pages2k_updated_Palmyra_dataset.pkl')
# pdb_p2k = cfr.ProxyDatabase().from_df(df)

# load from the cloud
pdb_p2k = cfr.ProxyDatabase().fetch('PAGES2kv2')

# load pseudoPAGES2k dataset

# load from a local copy
# pdb_pp2k = cfr.ProxyDatabase().load_nc('./data/ppwn_SNRinf_rta.nc')

# load from the cloud
pdb_pp2k = cfr.ProxyDatabase().fetch('pseudoPAGES2k/ppwn_SNRinf_rta')
Dashboard for a tree.TRW record#
[3]:
# pick a record from the real PAGES2k dataset
pobj = pdb_p2k['NAm_136']

# specify a timespan
min_t = np.max([850, np.min(pobj.time)])
max_t = np.min([2000, np.max(pobj.time)])
timespan = (min_t, max_t)

# annualize the proxy series
pobj_ann = pobj.slice(timespan).annualize()

# bind the pseudoproxy counterpart
pobj_ann.pseudo = pdb_pp2k[pobj.pid].slice(timespan)

# plot the dashboard
fig, ax = pobj_ann.dashboard()
cfr.showfig(fig)
cfr.savefig(fig, f'./figs/{pobj.pid}.pdf')
/Users/fengzhu/Apps/miniconda3/envs/cfr-env/lib/python3.9/site-packages/pyleoclim/core/series.py:151: UserWarning: No time_unit parameter provided. Assuming years CE.
  warnings.warn(f'No time_unit parameter provided. Assuming {time_unit}.', UserWarning)
/Users/fengzhu/Apps/miniconda3/envs/cfr-env/lib/python3.9/site-packages/pyleoclim/core/series.py:158: UserWarning: No time_name parameter provided. Assuming "Time".
  warnings.warn('No time_name parameter provided. Assuming "Time".', UserWarning)
Time axis values sorted in ascending order
OMP: Info #276: omp_set_nested routine deprecated, please use omp_set_max_active_levels instead.
Time axis values sorted in ascending order
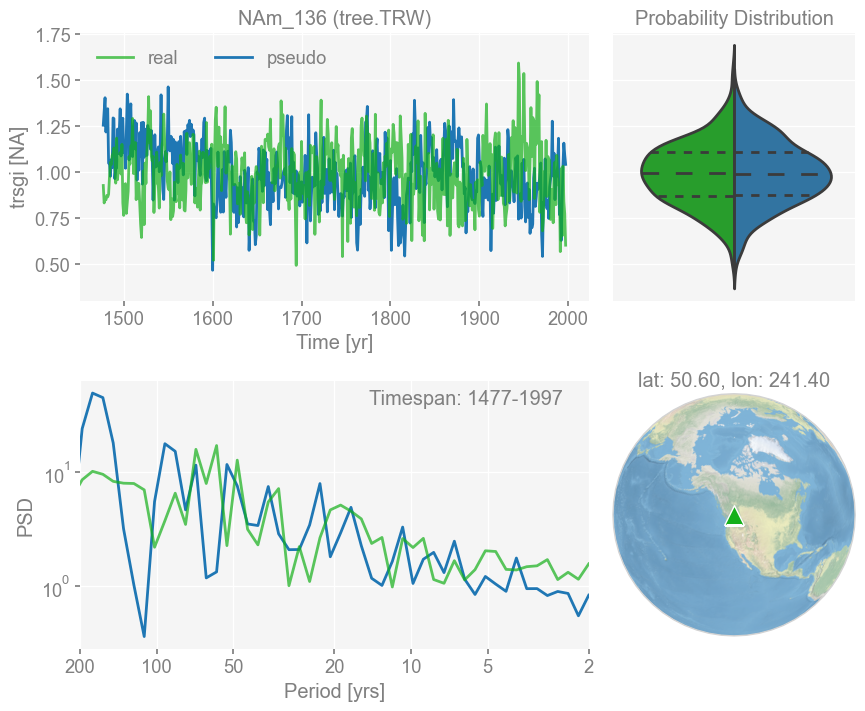
Figure saved at: "figs/NAm_136.pdf"
Dashboard for a tree.MXD record#
[4]:
# pick a record from the real PAGES2k dataset
pobj = pdb_p2k['NAm_134']

# specify a timespan
min_t = np.max([850, np.min(pobj.time)])
max_t = np.min([2000, np.max(pobj.time)])
timespan = (min_t, max_t)

# annualize the proxy series
pobj_ann = pobj.slice(timespan).annualize()

# bind the pseudoproxy counterpart
pobj_ann.pseudo = pdb_pp2k[pobj.pid].slice(timespan)

# plot the dashboard
fig, ax = pobj_ann.dashboard()
cfr.showfig(fig)
cfr.savefig(fig, f'./figs/{pobj.pid}.pdf')
Time axis values sorted in ascending order
Time axis values sorted in ascending order
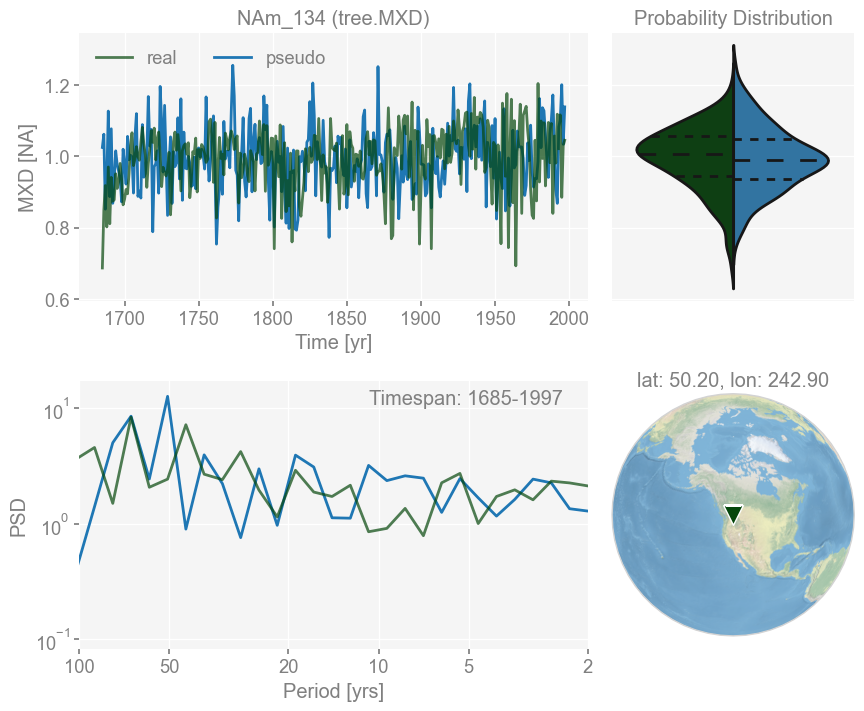
Figure saved at: "figs/NAm_134.pdf"
Dashboard for a coral.d18O record#
[5]:
# pick a record from the real PAGES2k dataset
pobj = pdb_p2k['Ocn_075']

# specify a timespan
min_t = np.max([850, np.min(pobj.time)])
max_t = np.min([2000, np.max(pobj.time)])
timespan = (min_t, max_t)

# annualize the proxy series
pobj_ann = pobj.slice(timespan).annualize()

# bind the pseudoproxy counterpart
pobj_ann.pseudo = pdb_pp2k[pobj.pid].slice(timespan)

# plot the dashboard
fig, ax = pobj_ann.dashboard()
cfr.showfig(fig)
cfr.savefig(fig, f'./figs/{pobj.pid}.pdf')
Time axis values sorted in ascending order
Time axis values sorted in ascending order
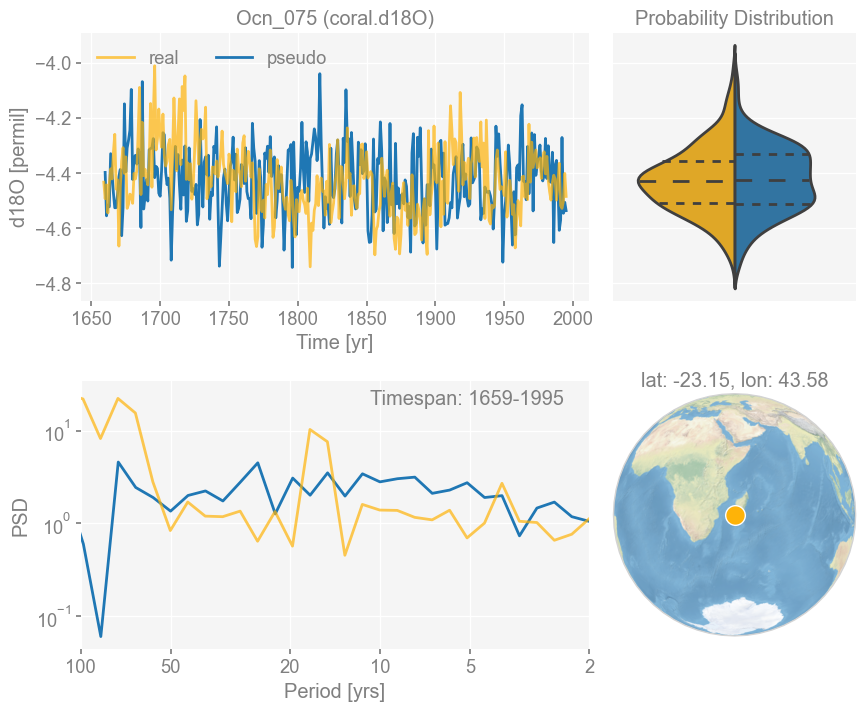
Figure saved at: "figs/Ocn_075.pdf"
Dashboard for a coral.SrCa record#
[6]:
# pick a record from the real PAGES2k dataset
pobj = pdb_p2k['Ocn_067']

# specify a timespan
min_t = np.max([850, np.min(pobj.time)])
max_t = np.min([2000, np.max(pobj.time)])
timespan = (min_t, max_t)

# annualize the proxy series
pobj_ann = pobj.slice(timespan).annualize()

# bind the pseudoproxy counterpart
pobj_ann.pseudo = pdb_pp2k[pobj.pid].slice(timespan)

# plot the dashboard
fig, ax = pobj_ann.dashboard()
cfr.showfig(fig)
cfr.savefig(fig, f'./figs/{pobj.pid}.pdf')
Time axis values sorted in ascending order
Time axis values sorted in ascending order
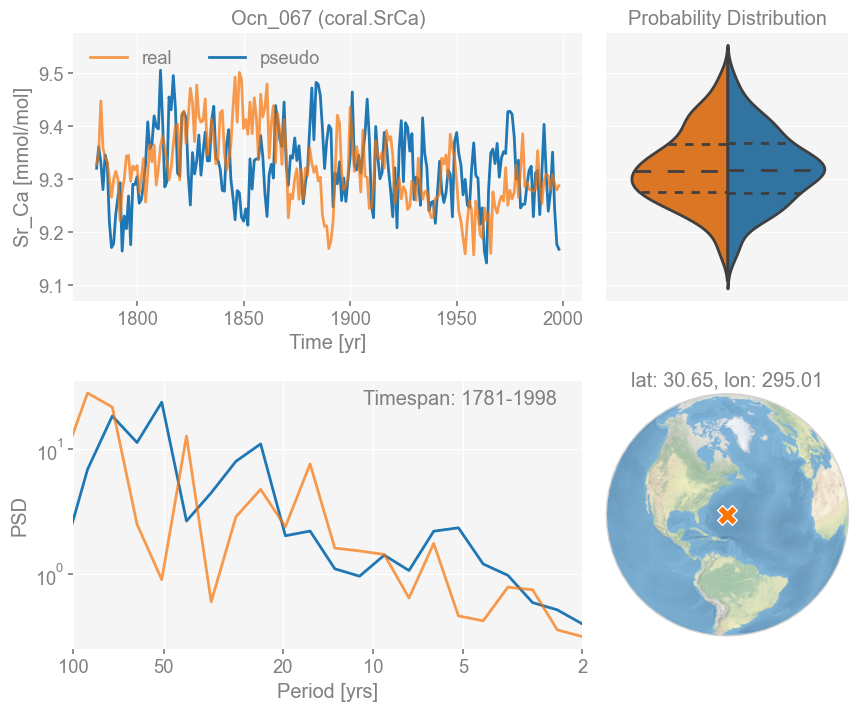
Figure saved at: "figs/Ocn_067.pdf"
Dashboard for a ice.d18O record#
[7]:
# pick a record from the real PAGES2k dataset
pobj = pdb_p2k['Arc_029']

# specify a timespan
min_t = np.max([850, np.min(pobj.time)])
max_t = np.min([2000, np.max(pobj.time)])
timespan = (min_t, max_t)

# annualize the proxy series
pobj_ann = pobj.slice(timespan).annualize()

# bind the pseudoproxy counterpart
pobj_ann.pseudo = pdb_pp2k[pobj.pid].slice(timespan)

# plot the dashboard
fig, ax = pobj_ann.dashboard()
cfr.showfig(fig)
cfr.savefig(fig, f'./figs/{pobj.pid}.pdf')
Time axis values sorted in ascending order
Time axis values sorted in ascending order
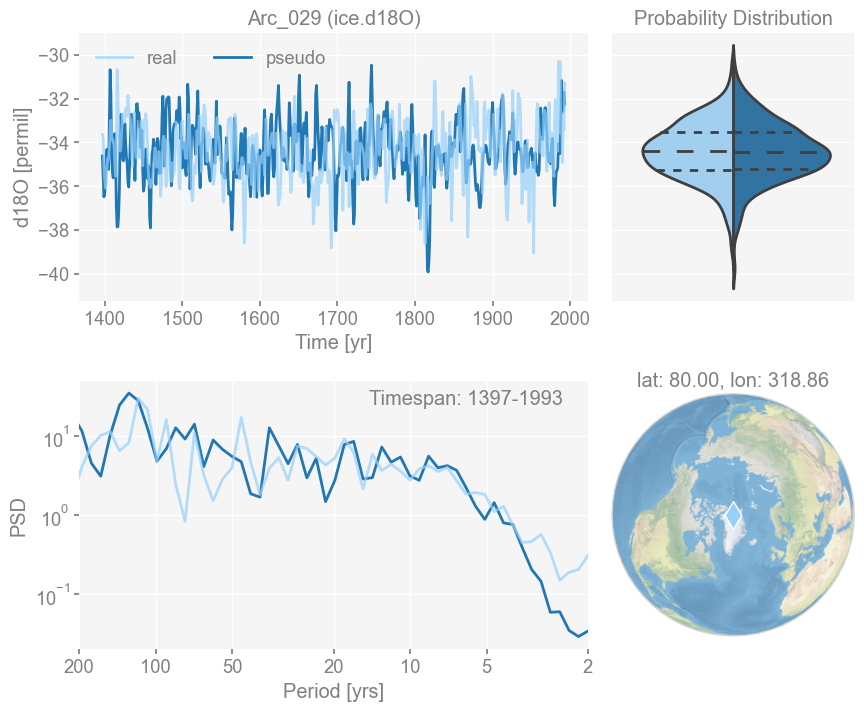
Figure saved at: "figs/Arc_029.pdf"
Dashboard for a lake.varve_thickness record#
[8]:
# pick a record from the real PAGES2k dataset
pobj = pdb_p2k['Arc_025']

# specify a timespan
min_t = np.max([850, np.min(pobj.time)])
max_t = np.min([2000, np.max(pobj.time)])
timespan = (min_t, max_t)

# annualize the proxy series
pobj_ann = pobj.slice(timespan).annualize()

# bind the pseudoproxy counterpart
pobj_ann.pseudo = pdb_pp2k[pobj.pid].slice(timespan)

# plot the dashboard
fig, ax = pobj_ann.dashboard()
cfr.showfig(fig)
cfr.savefig(fig, f'./figs/{pobj.pid}.pdf')
Time axis values sorted in ascending order
Time axis values sorted in ascending order
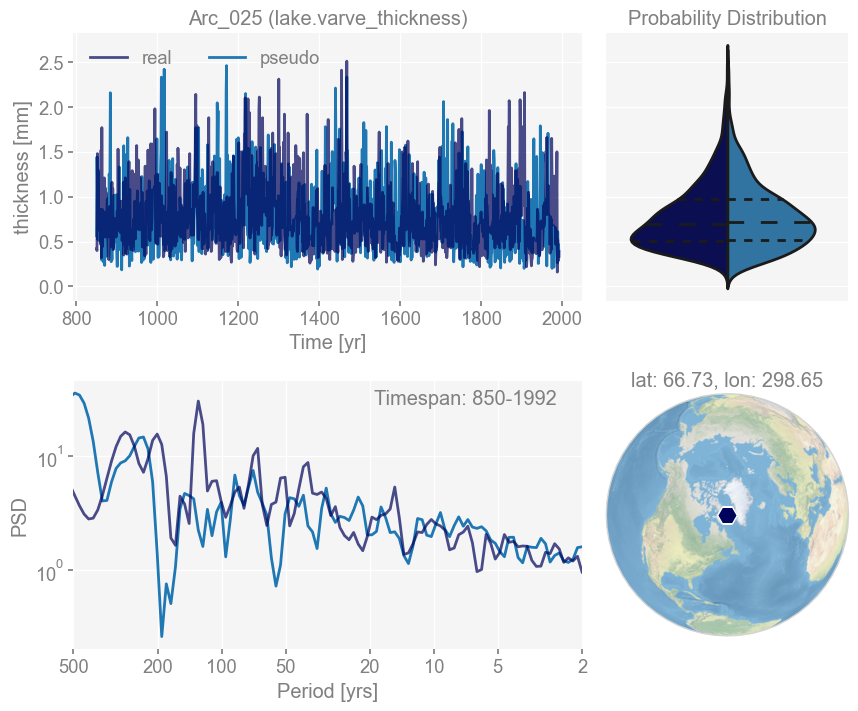
Figure saved at: "figs/Arc_025.pdf"